AUD to USD: What Commodities and China Trade Mean for the Aussie Dollar
An AUD to USD converter gave a very different answer in July 2011 than it does today. Back then, A$1,000 came back as US$1,108 — the Australian dollar was worth morethan the US dollar, and had been for months. Today the same thousand fetches about US$694. Same two countries, same two currencies, a 37% swing. This page converts Australian dollars to US dollars at the live mid-market rate, and the article explains the machinery behind swings that size: iron ore, China's construction cycle, and the interest-rate gap between the Reserve Bank of Australia and the Federal Reserve.
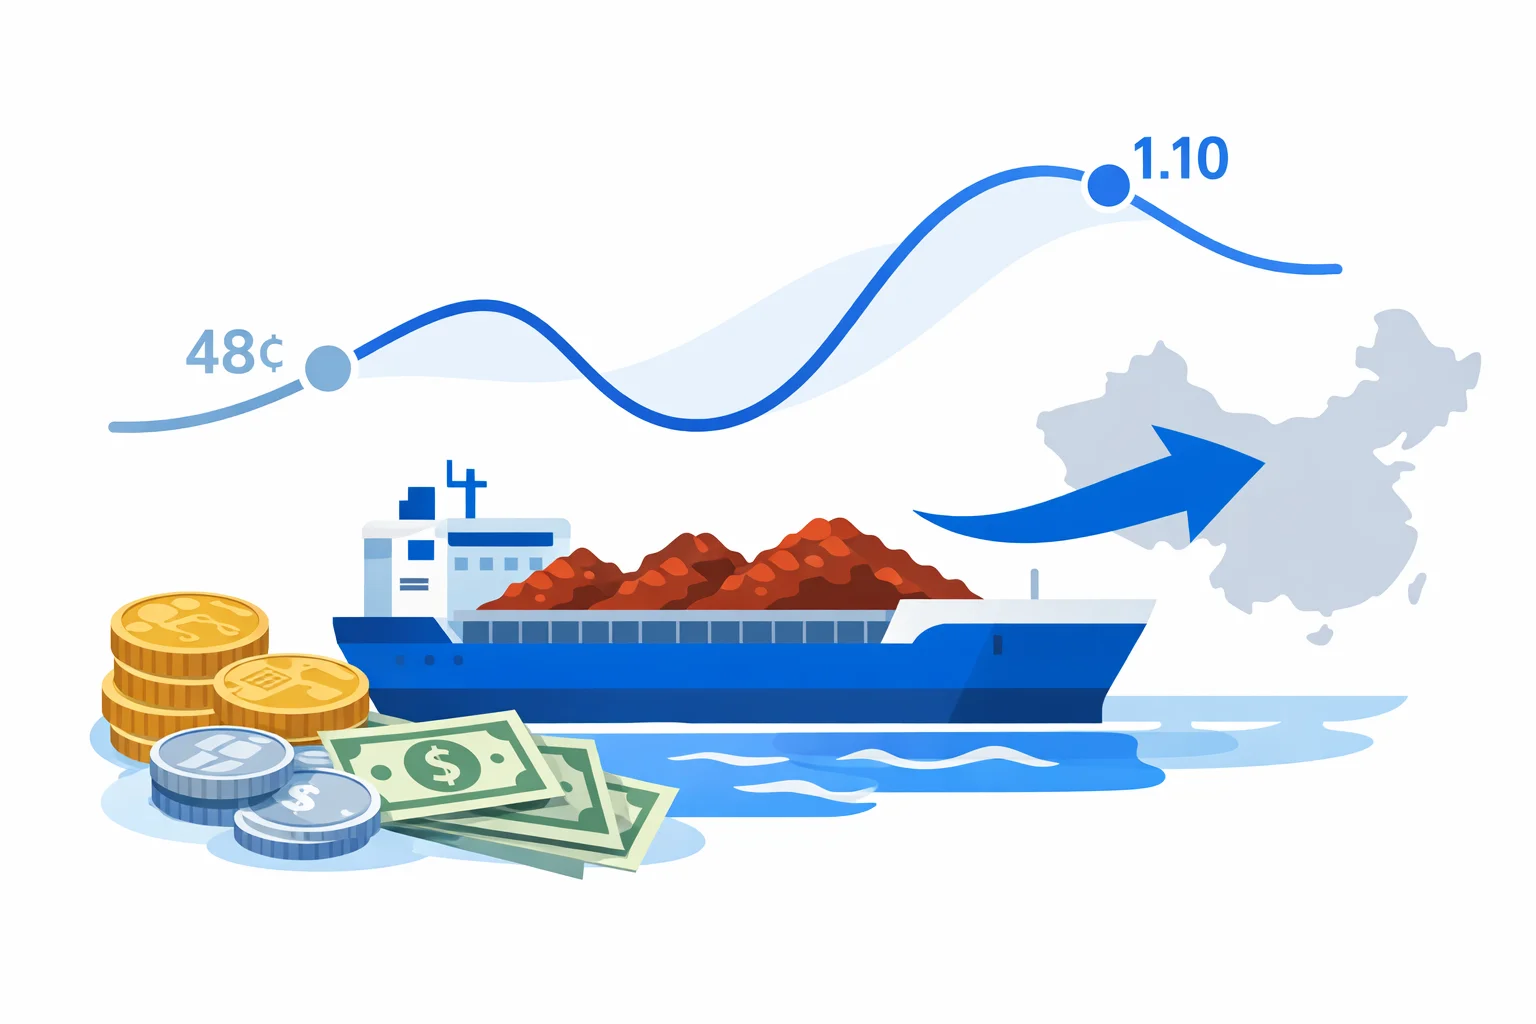
From $1.108 to 69 Cents: The Aussie's Round Trip
The Australian dollar has floated freely since 8 December 1983, when the Hawke government stopped pegging it and let the market set the price. It began floating life at about 90 US cents. Since then it has traded as low as US$0.4775 (April 2001, when dot-com money stampeded into US assets) and as high as US$1.1080 (27 July 2011, the top of the mining boom). That's a 2.3× range — far wider than the euro or pound have managed over the same stretch.
The parity years are the part that surprises people. From October 2010 to May 2013 one Australian dollar bought more than one US dollar, peaking near $1.11. Australians shopped US websites like everything was 10% off; American visitors found Sydney brutally expensive. The engine was China's post-GFC stimulus, which sent iron ore above US$180 a tonne while the RBA paid 4.75% interest against a Federal Reserve stuck at zero. When both props fell away — ore prices halved by 2015, the Fed started hiking in 2015-2018 — the Aussie slid back into the 60s and 70s, where it has mostly lived since. The RBA's historical exchange-rate data lets you trace the whole journey day by day.
Multiply, Don't Divide — and Mind the 2× Error
Because one Aussie dollar is worth less than one US dollar, AUD to USD is a multiply conversion:
US dollars = Australian dollars × rate
Worked through at 0.694: A$100 × 0.694 = US$69.40. A$1,000 × 0.694 = US$694. A$25,000 — a used car, a semester of tuition — comes to US$17,350. Going the other way, divide: US$500 ÷ 0.694 = A$720.46, which you can check against our multi-currency converter.
Here's why this particular pair punishes the wrong operation. Divide A$500 by 0.694 by mistake and you get US$720.46 — a number that looks completely plausible. It's wrong by a factor of 2.08. Make the same mistake with yen and you get obvious nonsense (¥5,000 "converting" to $775,000), so you catch it instantly. With the Aussie sitting at 0.69, the wrong answer sits close enough to the right one that it slips into budgets and invoices. A quick sanity anchor: the US-dollar figure must always be smaller than the Aussie figure — roughly 30% smaller at current rates.
One more convention worth knowing: AUD/USD is quoted with the Australian dollar as the base — one of only a handful of currencies quoted that way against the greenback, alongside the euro, pound, and New Zealand dollar. That's why traders say "the Aussie is at 69 cents" rather than quoting Aussie dollars per US dollar. One pip is 0.0001, so a move from 0.6940 to 0.7040 — 100 pips, a normal fortnight — shifts the value of an A$10,000 transfer by US$100.
Iron Ore Writes the Aussie's Price Tag
Australia earned about A$138 billion from iron ore in FY2023-24 — its single biggest export by a wide margin, ahead of coal (~A$91 billion) and LNG (~A$69 billion). Resources make up roughly half of all goods exports. That mix is why the Aussie is called a commodity currency: when the stuff Australia digs up gets more expensive, foreign buyers need more Australian dollars to pay for it, and the exchange rate tends to rise with the ore price.
The correlation shows up in the record books. Iron ore hit its all-time high of about US$237 a tonne on 12 May 2021; the Aussie had just spent February–May 2021 hovering near US$0.80, its strongest run since 2018. Flip it around: when ore collapsed below US$40 a tonne in December 2015, the Aussie sank to US$0.6827 within weeks — then its lowest level since 2009. No other G10 currency tracks a single commodity that tightly except the Canadian dollar, which plays the same game with oil — our CAD to USD converter covers how the 2014-16 crude crash dragged the loonie from US$0.94 to US$0.68. Same mechanism, different rock.
It's not all mining, though. Education is Australia's biggest export that doesn't come out of the ground: international students brought in about A$51 billion in FY2023-24 — more than gold. Every semester's tuition paid from overseas is, mechanically, a purchase of Australian dollars.
Why Traders Buy Aussie Dollars to Bet on China
China takes about a third of Australia's goods exports — including roughly 85% of the iron ore — which makes Australian export income a nearly direct function of Chinese construction activity. A bad Chinese property quarter means fewer steel mills ordering ore, which means fewer foreign buyers needing AUD. The causal chain from a Beijing data release to the AUD/USD rate is about as short as macro gets.
But there's a second, less obvious layer. China's own currency, the yuan, is managed by the People's Bank of China and can't be traded freely offshore at scale. So when a global fund wants to express a view on Chinese growth — long or short — it often trades the Aussie instead: a fully floating, deeply liquid currency whose fortunes are chained to Chinese demand. The Australian dollar is the world's sixth most-traded currency, and AUD/USD handles about 5% of global FX turnover per the BIS triennial survey — vastly more than Australia's ~1% share of world GDP would suggest. That excess liquidity is largely the China-proxy trade. The practical upshot for anyone converting: the rate can jump on a Chinese PMI print at 11:45am Sydney time even when nothing happened in Australia or America.
A Currency That Falls When the World Panics
The Aussie is a risk-on currency. When markets are calm and growing, money flows toward higher-yielding, trade-exposed currencies like the AUD. When markets panic, that money runs home to the US dollar — and the Aussie drops even if Australia itself is fine. March 2020 is the textbook case: the Aussie fell to US$0.5510 on 19 March, down roughly 9% in days, while Australia had barely recorded its first COVID wave. Within a year it was back near US$0.80, riding China's restart and record ore prices.
The Japanese yen behaves exactly the opposite way — it strengthens in a panic, as Japanese investors repatriate overseas assets and carry trades unwind. Our JPY to USD converter covers that safe-haven mechanics in detail. The pairing matters because AUD/JPY is the market's classic fear gauge: both legs move against you in a crisis. If you hold Aussie dollars and plan to convert during a global risk event, you're selling at the worst moment the cycle offers — March 2020 sellers got 55 cents for dollars that fetched 69 cents two months earlier and 80 cents a year later.
The RBA–Fed Gap Behind the Parity Years
Commodities set the Aussie's long arc; interest-rate differentials set its lean. Through the parity years the gap was enormous: the RBA's cash rate stood at 4.75% in 2011 while the Fed held 0–0.25%. Parking money in Australian dollars paid roughly 4.5 points more than parking it in US dollars, and that yield advantage — stacked on top of the ore boom — is what pushed the Aussie past $1.10.
The 2022-24 cycle ran the film in reverse. The Fed hiked to a 5.25–5.50% ceiling while the RBA topped out at 4.35% — the first sustained stretch since the early 2000s where US cash out-yielded Australian cash. The Aussie spent those years pinned in the 0.63–0.69 band despite healthy export volumes. It's a useful diagnostic when reading the rate: if ore prices are steady but the Aussie is sagging, the rate gap is usually the culprit.
Common Mistakes With Aussie-Dollar Conversions
- Dividing instead of multiplying. A$2,000 ÷ 0.694 = US$2,881.84, a plausible-looking figure that overstates the true US$1,388 by 2.08×. The check: the USD number must be about 30% smaller than the AUD number.
- Treating "$" as one currency.Both countries use the same symbol. An Australian invoice reading "$4,500" means Australian dollars — about US$3,123 — unless it explicitly says USD. On a car-sized amount, misreading the symbol costs US$1,377.
- Using a stale rate on a big transfer.The Aussie routinely moves 100 pips (1 US cent) in a week or two. On an A$50,000 property or tuition transfer, converting at last month's 0.7040 when the market sits at 0.6940 misstates the outcome by US$500.
- Watching only American news. The rate answers to three masters: the Fed, the RBA, and Chinese commodity demand. A surprise in Chinese property data or an iron-ore price move can shift AUD/USD a cent in a session with zero US headlines involved.
When You Won't Get the Mid-Market Rate
The rate above is the mid-market rate — the midpoint between global buy and sell prices. Nobody retail gets exactly that. Specialist transfer services typically price 0.5–1% away from it (US$35–69 on an A$10,000 conversion), banks commonly 2–3% plus a A$20–30 wire fee (US$140–210 on the same amount), and airport desks worse still. The rate you should compare every quote against is the one this page shows; the difference between quote and mid-market is the real fee, whatever the provider calls it. Our general currency converter lets you add a provider markup to any pair and see the take-home directly.
One habit worth stealing from the professionals: on large conversions, don't bet the lot on a single day's rate. The Aussie's history — 47.75 cents to $1.108 and back — is a history of moves nobody timed perfectly. Splitting an A$50,000 transfer into two or three tranches a few weeks apart won't catch the top, but it guarantees you don't convert everything at the bottom of a risk-off week either.