JPY to USD: What Really Moves the Yen-Dollar Rate
The JPY to USD exchange rate is driven by one number more than any other: the gap between US and Japanese interest rates. At roughly ¥155 per dollar in 2026, with the Federal Reserve paying near 4.5% and the Bank of Japan sitting close to 0.5%, that four-point gap explains why the yen trades where it does — and why it slid from about 110 to past 150 in barely three years. If you want to understand the yen-dollar rate rather than just read it off a screen, the interest-rate gap is where the story starts.
Reading a USD/JPY Quote (Higher = Weaker Yen)
You'll almost never see the pair written as “JPY/USD.” Because a single yen is worth only about $0.0065, quoting it that way would fill the screen with zeros, so the market flips it: the standard quote is USD/JPY, the number of yen it takes to buy one dollar. At ¥155, one dollar buys 155 yen. To go from yen to dollars you divide — ¥5,000 ÷ 155 ≈ $32.26 — and to go the other way you multiply.
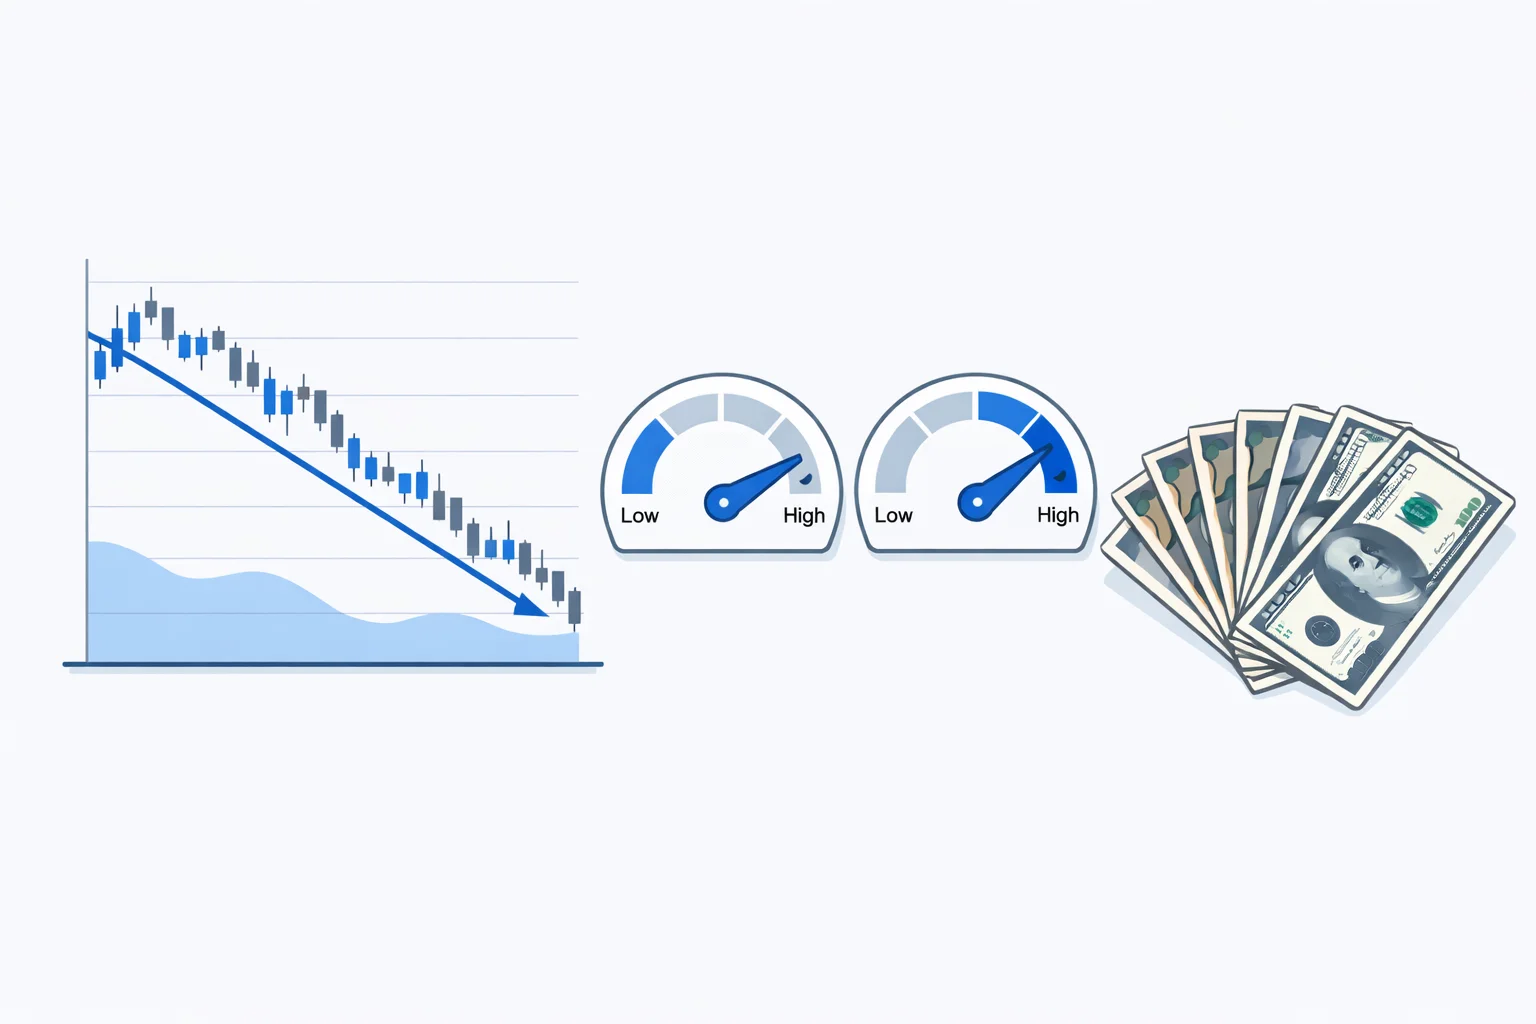
Here's the part that trips people up. When the USD/JPY number rises from 140 to 160, the yen has gotten weaker, not stronger, because each yen now buys fewer dollars. A “strong yen” is a low number — ¥100 or ¥90 — and a “weak yen” is a high one. The strong/weak gauge in the converter above places the live rate on that scale so the direction is obvious at a glance. If you just want the everyday traveler's take on reading price tags, our yen to dollars converter covers the practical side without the market mechanics.
The Interest-Rate Gap Is the Engine
Money chases yield. When US Treasury bills pay around 4.5% and Japanese government bonds pay closer to 0.5%, global investors sell yen to buy dollar assets, and that selling pushes the yen down. This is why the yen's multi-year slide lines up almost exactly with the Fed's 2022–2023 hiking cycle: as the US rate climbed from near zero to above 5% while the Bank of Japan held near zero, the gap yawned open and the yen fell from the 110s to the 150s.
Work a quick example. Say you hold the dollar equivalent of ¥1,000,000 — about $6,452 at 155. Park it in a dollar money-market account paying the four-point spread over yen, and a year later you've earned roughly $258 in interest you'd never have seen holding yen. That spread is the whole reason the “carry trade” exists, and the interest-rate panel in the tool computes it for whatever amount you enter. According to the Federal Reserve's policy record, the funds rate has swung from 0.25% to over 5% and back within a single decade — each move rippling straight into USD/JPY.
The Yen Carry Trade — and the Day It Snapped
The carry trade is deceptively simple: borrow yen at Japan's rock-bottom rate, convert to dollars, and collect the higher US yield. As long as the exchange rate holds, you pocket the roughly 4% gap for doing nothing. Hedge funds and ordinary Japanese savers alike have run this trade for years, and the sheer volume of borrowed yen flowing into higher-yielding assets is one reason the yen stayed weak.
The catch is that it only works while the yen behaves. When the yen suddenly strengthens, everyone racing to repay their yen loans has to buy yen at once, which strengthens it further — a feedback loop. That's exactly what hit on 5 August 2024. A surprise Bank of Japan hike collided with weak US jobs data, the yen jumped, and the unwind cascaded worldwide: Japan's Nikkei 225 fell about 12% in a single session — its worst day since 1987. The break-even figure in the converter shows the flip side of the trade: at a 4% carry, a yen rally of just 4% (USD/JPY dropping from 155 to about 148.8) erases a full year's interest in days.
Why Bad News Makes the Yen Stronger
Here's a genuine oddity: when global markets panic, the yen usually rises— even when Japan isn't the source of the trouble. During the 2008 financial crisis, a US-born meltdown, the yen strengthened sharply. After the March 2011 earthquake and tsunami — a catastrophe inside Japan — the yen still surged to its all-time high of about 75 per dollar that October.
Two forces explain it. First, Japanese investors hold trillions of dollars of overseas assets; in a crisis they sell those and bring the money home, buying yen. Second, panic triggers carry-trade unwinds, which mechanically buy back yen. So the yen behaves like a shock absorber — weak and drifting lower when markets are calm and chasing yield, snapping stronger the moment fear takes over. That safe-haven reflex is why a yen position can move opposite to almost everything else in a portfolio.
From ¥360 to ¥160: Fifty Years of the Yen
The yen's modern history is a long march from weak to strong and partway back. Under the post-war Bretton Woods system, the yen was fixed at exactly 360 per dollar until 1971. Once currencies were allowed to float, the yen began a decades-long climb, supercharged by the 1985 Plaza Accord, when major governments deliberately drove the dollar down and the yen roughly doubled in value within three years.
| Year | Approx. USD/JPY | What was happening |
|---|---|---|
| 1949–1971 | ¥360 (fixed) | Bretton Woods peg |
| 1985 | ¥240 → ¥150 | Plaza Accord drives the dollar down |
| 2011 | ¥75.35 | Record-strong yen after the earthquake |
| 2021 | ¥110 | Fed still near zero |
| 2024 | ~¥160 | Widest US–Japan rate gap in decades |
That ¥75.35 low on 31 October 2011 remains the strongest the yen has ever been. Put the two extremes side by side and the range is staggering: the same dollar that bought 360 yen in 1970 bought just 75 in 2011 — before weakening back toward 160. No other major currency has traveled that far.
What a One-Yen Move Is Actually Worth
Traders talk in fractions of a yen, but for anyone moving real money the useful unit is a whole yen. On a ¥1,000,000 position, the difference between converting at 150 and 155 is real: ¥1,000,000 ÷ 150 = $6,667, versus ¥1,000,000 ÷ 155 = $6,452 — a $215 swing from a five-yen move. Scale that to a ¥10,000,000 remittance and each single yen of rate is worth roughly $415.
This is why timing feels tempting on large transfers and pointless on small ones. Sending ¥30,000 to a friend? A one-yen wobble changes the result by about 13 cents — not worth a second thought. Wiring ¥5,000,000 for a property deposit? The same wobble is worth about $208, and the provider's spread matters even more. To see how those markups eat into any cross-border transfer, our multi-currency converter lets you add a provider margin and compare the real take-home.
When the Rate Matters Less Than You Think
For a one-off conversion, obsessing over the daily rate is usually a mistake. The yen can move 2–3% in a week, but the spread and fees your bank or app charges are often a bigger, more certain cost — a 3% markup on a ¥1,000,000 transfer is about $194 gone before the rate even enters the picture. Nail down a low-margin provider first; the exact day you convert is noise by comparison.
Watching the rate doespay off in two cases: large lump sums where a 2% swing is worth thousands, and recurring flows — tuition, payroll, pension income — where a persistent trend compounds over years. If you're a dollar-holder looking at the same pair from the other direction, planning a Japan trip or paying a yen invoice, our USD to JPY converter frames the strong dollar as buying power rather than a cost. Either way, the rule holds: understand what moves the rate, then spend your energy on how you convert, not on predicting the next tick.